Research library
Software engineering: completion history
All area pages | Area definition | Scoring rubric
Created November 7, 2026. The three earlier snapshots are retrospective judgment-based estimates, not scores recorded at the time. The current assessment is unchanged. Historical confidence is very low; current confidence is low. Zero can indicate an evidence gap rather than absent capability.
Chart layout updated November 8, 2026: one graph with four dated lines. Scores and assessment dates are unchanged. Overlapping lines indicate equal values; point labels show November 7, 2026. The table below contains every date's exact values.
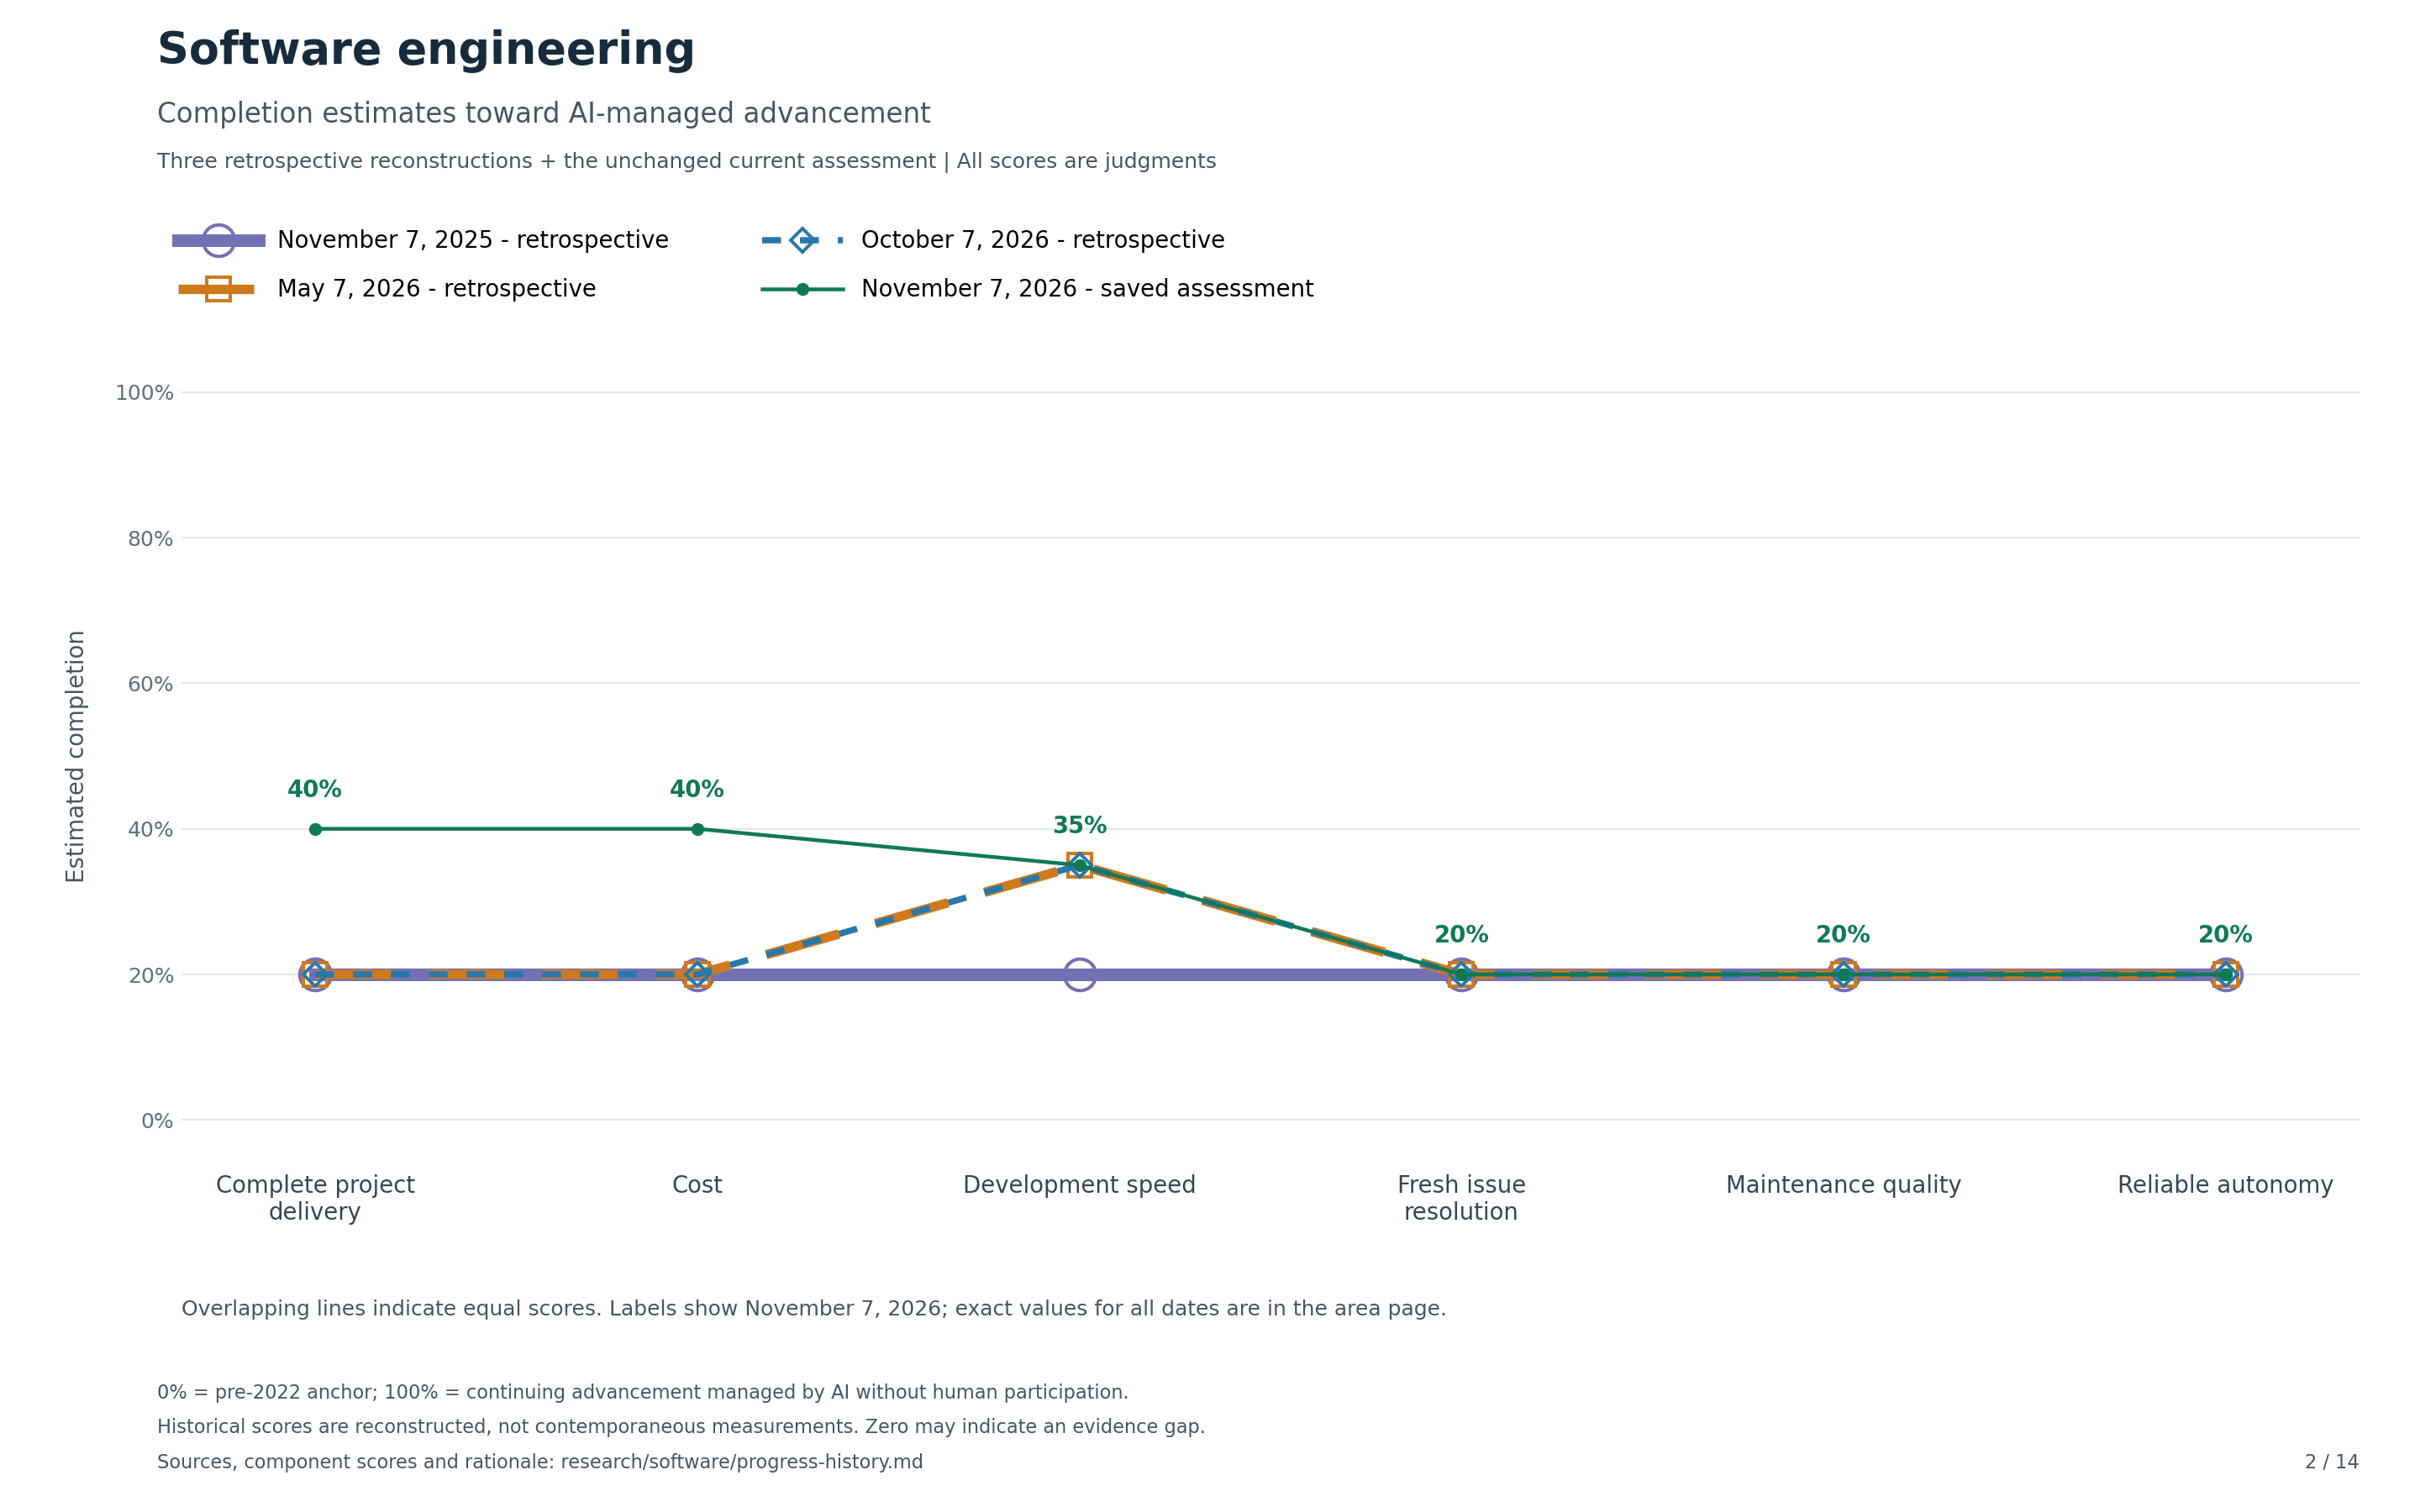
Scalable graph | Combined 14-page report
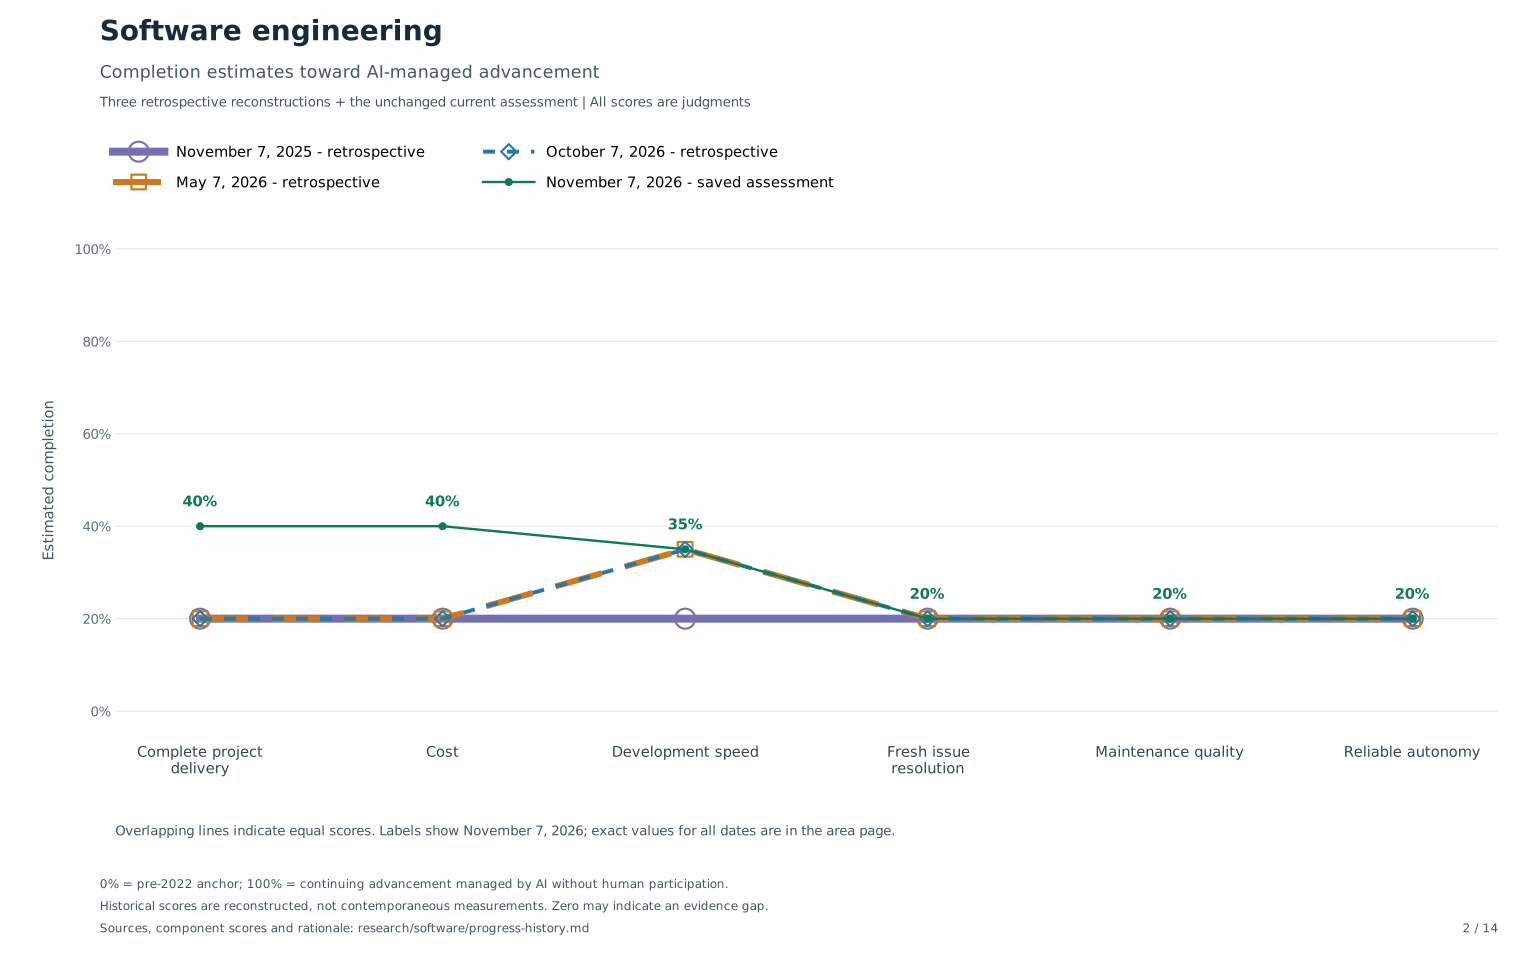
Percentage estimates
| Measurable outcome | Nov 7, 2025 (reconstructed) | May 7, 2026 (reconstructed) | Oct 7, 2026 (reconstructed) | Nov 7, 2026 (saved) |
|---|---|---|---|---|
| Complete project delivery | 20% | 20% | 20% | 40% |
| Cost | 20% | 20% | 20% | 40% |
| Development speed | 20% | 35% | 35% | 35% |
| Fresh issue resolution | 20% | 20% | 20% | 20% |
| Maintenance quality | 20% | 20% | 20% | 20% |
| Reliable autonomy | 20% | 20% | 20% | 20% |
Reconstruction notes and component scores
Components below are execution / breadth / agenda-setting / validation / sustained autonomous improvement, each out of 20. Their sum gives the percentage. The component values are judgments, not published statistics. Source links document evidence available by the cutoff, not the numerical estimate itself. The source section lists availability dates and version caveats. No area-wide average is calculated.
Complete project delivery
Earlier bounded-task studies give only an enabling proxy for complete project delivery. The current ProgramBench observation is not backdated from its live leaderboard.
| Assessment date | Component points | Evidence used |
|---|---|---|
| 2025-11-07 (reconstructed) | 5 / 5 / 5 / 5 / 0 = 20% | metr25 |
| 2026-05-07 (reconstructed) | 5 / 5 / 5 / 5 / 0 = 20% | metr25 |
| 2026-10-07 (reconstructed) | 5 / 5 / 5 / 5 / 0 = 20% | metr25 |
| 2026-11-07 (saved) | 10 / 10 / 5 / 10 / 5 = 40% | Original score and evidence |
Cost
Historical labor and bounded-task evidence does not establish full cost per accepted project. Only the current snapshot includes the saved ProgramBench API-cost observation.
| Assessment date | Component points | Evidence used |
|---|---|---|
| 2025-11-07 (reconstructed) | 5 / 5 / 5 / 5 / 0 = 20% | metr25, slow25 |
| 2026-05-07 (reconstructed) | 5 / 5 / 5 / 5 / 0 = 20% | metr25, uplift |
| 2026-10-07 (reconstructed) | 5 / 5 / 5 / 5 / 0 = 20% | metr25, uplift |
| 2026-11-07 (saved) | 10 / 10 / 5 / 10 / 5 = 40% | Original score and evidence |
Development speed
The 2025 controlled slowdown constrains the earlier judgment. February 2026 broadens the evidence but remains uncertain; the score does not imply a measured 35% speedup.
| Assessment date | Component points | Evidence used |
|---|---|---|
| 2025-11-07 (reconstructed) | 5 / 5 / 5 / 5 / 0 = 20% | slow25 |
| 2026-05-07 (reconstructed) | 10 / 10 / 5 / 5 / 5 = 35% | uplift |
| 2026-10-07 (reconstructed) | 10 / 10 / 5 / 5 / 5 = 35% | uplift |
| 2026-11-07 (saved) | 10 / 10 / 5 / 5 / 5 = 35% | Original score and evidence |
Fresh issue resolution
Real repository work supports limited workflow credit, but no qualifying post-cutoff hidden-test/maintainer success rate. A later benchmark refresh alone is not scored as a gain.
| Assessment date | Component points | Evidence used |
|---|---|---|
| 2025-11-07 (reconstructed) | 5 / 5 / 5 / 5 / 0 = 20% | metr25, slow25 |
| 2026-05-07 (reconstructed) | 5 / 5 / 5 / 5 / 0 = 20% | metr25, slow25 |
| 2026-10-07 (reconstructed) | 5 / 5 / 5 / 5 / 0 = 20% | metr25, slow25 |
| 2026-11-07 (saved) | 5 / 5 / 5 / 5 / 0 = 20% | Original score and evidence |
Maintenance quality
Bounded coding and review evidence supports only preliminary quality control. The required longitudinal defect follow-up remains absent at each cutoff.
| Assessment date | Component points | Evidence used |
|---|---|---|
| 2025-11-07 (reconstructed) | 5 / 5 / 5 / 5 / 0 = 20% | metr25, slow25 |
| 2026-05-07 (reconstructed) | 5 / 5 / 5 / 5 / 0 = 20% | metr25, slow25 |
| 2026-10-07 (reconstructed) | 5 / 5 / 5 / 5 / 0 = 20% | metr25, slow25 |
| 2026-11-07 (saved) | 5 / 5 / 5 / 5 / 0 = 20% | Original score and evidence |
Reliable autonomy
The original long-task study supports limited autonomy. Do not use later embedded chart updates or extrapolate the reported trend to invent historical scores.
| Assessment date | Component points | Evidence used |
|---|---|---|
| 2025-11-07 (reconstructed) | 5 / 5 / 5 / 5 / 0 = 20% | metr25 |
| 2026-05-07 (reconstructed) | 5 / 5 / 5 / 5 / 0 = 20% | metr25 |
| 2026-10-07 (reconstructed) | 5 / 5 / 5 / 5 / 0 = 20% | metr25 |
| 2026-11-07 (saved) | 5 / 5 / 5 / 5 / 0 = 20% | Original score and evidence |
Dated sources
All sources accessed November 7, 2026. Dates below are publication or conservative availability dates, as noted.
metr25 | 2025-03-19 - METR long software task study. Use the original study discussion, excluding later embedded chart updates; bounded task autonomy.
slow25 | 2025-07-10 - METR developer productivity randomized study. Study found slower completion in its setting; February 2026 update excluded from 2025.
uplift | 2026-02-24 - METR: developer productivity update. Updated developer study; uncertain estimates and selection problems.
Future updates
Keep these reconstructions separate from subsequently recorded observations. Append new dated assessments with changed component scores and source evidence; do not silently replace historical reasoning. The shared historical-method notes describe how these snapshots were made.